Craig spotted the “For Lease” sign while driving through Anaheim.
2,400 square feet. Good visibility. Half a mile from the convention center. Surrounded by hotels.
He pulled over, wrote down the number, and drove off.
That night, he couldn’t stop thinking about it. His Santa Ana location was doing $396,000 annually and running at capacity. Two locations could do $750,000. This was the obvious next move.
He’d been profitable for eight straight quarters. He had $37,000 saved for the down payment. He was ready.
Craig owned a dry cleaning business in Santa Ana—walk-in customers and a growing commercial account serving local hotels.
Three weeks later, his banker told him he wasn’t.
This article explains why — and what Craig didn’t understand about his own financial position.
In this article, you’ll learn:
- What your balance sheet is actually telling you
- The 3 ratios bankers care about (and the targets)
- A simple monthly routine to stay loan-ready
Craig’s Plan
Craig called the landlord. The space was $4,800 per month. He ran the numbers:
Startup costs:
- Buildout (plumbing, ventilation, installation): $75,000
- Equipment (washers, dryers, pressing equipment): $165,000
- Initial inventory and supplies: $12,000
- Working capital reserve (3 months operating expenses): $50,000
- Total: $302,000
Financing plan:
- Craig’s savings: $37,000
- SBA 7(a) loan: $265,000
Revenue projections: The Anaheim location would start slow but could reach $350,000 annually within 18 months. Combined with his Santa Ana location, he’d be approaching $750,000 in total revenue.
His current location generated $11,100 in profit per quarter. If Anaheim performed similarly once established, he’d be looking at $44,000+ in annual profit from two locations.
The math looked solid.
The CPA Conversation
Craig called his CPA to discuss the expansion.
The CPA asked questions:
- “What’s your current working capital position?”
- “How much debt are you carrying?”
- “Can your Santa Ana location support Anaheim losing money for the first six months?”
Craig answered confidently:
- “I’m profitable every quarter — $11,100 last quarter.”
- “I have some credit cards and an equipment loan, but I pay everything on time.”
- “My P&L looks good. My margins are solid.”
His CPA said: “You’ll need an SBA 7(a) loan — a government-guaranteed bank loan for small businesses. Talk to your banker. Bring your last two years of tax returns, your profit and loss statements, and your balance sheet.”
Craig had his tax returns and P&L statements readily available. He’d reviewed them dozens of times.
He emailed his bookkeeper: “Bank needs my balance sheet for a loan application. Can you send it?”
Craig Sees His Balance Sheet (For the First Time)
His bookkeeper sent it the next day.
Craig opened it and saw three sections: Assets, Liabilities, and Equity.
Assets: $127,000
- Cash: $43,000
- Accounts Receivable: $16,400
- Inventory: $8,200
- Equipment (net of depreciation): $59,400
Liabilities: $96,400
- Accounts Payable: $22,000
- Credit Cards: $28,000
- Equipment Loan: $46,400
Equity: $30,600
- Retained Earnings: $30,600
Craig saw the numbers but didn’t know what they meant.
He had $43,000 in cash. That seemed good.
He had $127,000 in total assets. That seemed solid.
He owed $96,400. That was his debts—the equipment loan, some credit cards, supplier invoices.
His equity was $30,600. That was… what he’d built up over time?
He forwarded the balance sheet to the bank and scheduled a meeting.
The Bank Meeting
Craig met with Jennifer, the business banker at his local bank.
He brought his materials: tax returns, P&L statements showing eight consecutive profitable quarters, his balance sheet, and a rough business plan outlining the Anaheim opportunity.
Jennifer reviewed his P&L first.
“Your margins look good,” she said. “Revenue’s trending up, gross margins are around 40%, and expenses are under control. You’re profitable every quarter.”
Craig felt confident.
Then Jennifer reviewed his balance sheet. She was quiet for a moment.
“Craig, your P&L shows a business that’s performing well. But I have some concerns about your balance sheet position.”
“What do you mean?” Craig asked. “I’m profitable every quarter. I just showed you — $11,100 last quarter alone.”
“Profitability and financial position are two different things,” Jennifer said. “Let me show you what I’m seeing.”
What the Banker Saw
Current Ratio
“First, let’s look at your current ratio,” Jennifer said.
She pulled out a calculator.
Current Assets: $67,600
- Cash: $43,000
- Accounts Receivable: $16,400
- Inventory: $8,200
Current Liabilities: $62,400
- Accounts Payable: $22,000
- Credit Cards: $28,000
- Current Portion of Equipment Loan (due within 12 months): $12,400
Current Ratio = Current Assets ÷ Current Liabilities
$67,600 ÷ $62,400 = 1.08
“A current ratio of 1.08 means you have $1.08 in current assets for every $1.00 in current liabilities,” Jennifer explained. “We typically want to see 1.5 or higher for business expansion loans. You’re operating with very little cushion.”
Working Capital
“Now let’s look at working capital,” Jennifer continued.
Working Capital = Current Assets – Current Liabilities
$67,600 – $62,400 = $5,200
“You have $5,200 in working capital,” Jennifer said. “That’s the cushion you have to operate day-to-day. Working capital isn’t cash—it’s what’s left after short-term obligations are netted against short-term assets.”
“But my cash balance is $43,000,” Craig said.
“Cash is spendable. Receivables must be collected. Inventory must be sold. Your cushion isn’t $43,000—it’s $5,200. And you still owe $62,400 soon.”
“For a business about to open a second location, $5,200 in working capital is very thin,” Jennifer said.
Debt-to-Equity Ratio
“Now let’s look at your debt-to-equity ratio,” Jennifer said.
Total Liabilities: $96,400 Total Equity: $30,600
Debt-to-Equity Ratio = Total Liabilities ÷ Total Equity
$96,400 ÷ $30,600 = 3.15
“For every dollar of equity you have in your business, you owe $3.15 in debt,” Jennifer explained. “If we add $265,000 in new debt for the Anaheim location, your total liabilities would be $361,400. Your debt-to-equity ratio would jump to 11.8. That’s outside our credit policy for this kind of loan.”
Craig sat back. He hadn’t thought about it that way.
The Bigger Problem
Jennifer leaned forward.
“Here’s my bigger concern, Craig. Opening the Anaheim location will cost $302,000 upfront. Then the location will burn money for the first six to nine months while you’re building clientele. Based on typical ramp-up curves, you’re looking at burn of $8,000 to $10,000 per month. That’s another $50,000 to $70,000 in cash you’ll need to cover.”
She pulled out Craig’s P&L.
“Your Santa Ana location generates $11,100 in profit per quarter. That’s about $3,700 per month of earnings. It’s not enough to fund an $8,000–$10,000 monthly burn. You’d be burning cash for six to nine months.”
“Plus, you’ll have debt service on the $265,000 loan—roughly $5,000 to $6,000 per month, depending on rate and term. So you’d need to cover Anaheim’s operating losses AND the loan payment AND maintain working capital for both locations.”
Craig did the mental math on cash burn:
- Anaheim burn: $8,000/month
- Loan payment: $5,500/month (midpoint estimate)
- Total cash need: $13,500/month
- Santa Ana contribution: ~$3,700/month
- Monthly shortfall: $9,800
For six months, that’s nearly $60,000 in additional cash he’d need.
He had $5,200 in working capital.
The math didn’t work.
Craig had profit. He didn’t have capacity.
Not Yet
Jennifer paused. “Not yet,” she said.
“Craig, I’m not denying your request. I’m telling you what needs to change before we can approve an expansion loan.”
She listed three things:
1. Improve your current ratio to at least 1.5
This meant either building more cash reserves, paying down current liabilities, or both.
2. Build working capital to at least $20,000
“You need a cushion,” Jennifer said. “Enough to handle slow months, unexpected expenses, and the Anaheim ramp-up period.”
3. Reduce your debt-to-equity ratio below 2.5
This meant either paying down existing debt, building more equity by retaining earnings, or both.
“If you can show me these improvements in nine to twelve months, we can revisit this conversation,” Jennifer said. “Or you might consider a phased approach—smaller buildout, leased equipment instead of purchased, start with a smaller footprint.”
Craig left the bank.
He wasn’t angry. He wasn’t defeated.
He was confused.
He’d been running a profitable business for two years. He paid all his bills on time. He had $43,000 in the bank. Why wasn’t that enough?
Craig wasn’t incompetent. He wasn’t bad with money. He simply hadn’t been exposed to how lenders think—and most business owners haven’t either until they apply for their first major loan.
That afternoon, Craig called his CPA.
“Jennifer said I’m not ready. Something about my balance sheet ratios. I don’t understand—I’m profitable every quarter.”
His CPA said: “Craig, profitability and financial position are different things. Your P&L shows performance. Your balance sheet shows whether you can survive and grow. We need to sit down and walk through this.”
Understanding the Balance Sheet
What It Measures
The balance sheet shows your financial position at a specific point in time.
Think of it as a financial snapshot—one day in time. While your P&L is dated “For the Period Ended [Date]” (showing performance over time), your balance sheet is dated “As of [Date]” (showing your position on a specific day).
It answers three questions:
- What do you own? (Assets)
- What do you owe? (Liabilities)
- What’s left over? (Equity)
The fundamental equation:
Assets = Liabilities + Equity
Or rearranged:
Assets – Liabilities = Equity
Everything you own, minus everything you owe, equals your equity in the business.
The Three Sections
Assets: What You Own
Assets are resources your business controls that have economic value.
Current Assets (convertible to cash within one year):
- Cash and cash equivalents
- Accounts receivable
- Inventory
Non-Current Assets (used over multiple years):
- Property, plant, and equipment
- Less: Accumulated depreciation
Assets are listed in order of liquidity—how quickly they convert to cash.
Liabilities: What You Owe
Liabilities are obligations your business must pay.
Current Liabilities (due within one year):
- Accounts payable
- Credit cards
- Accrued expenses (payroll, taxes)
- Current portion of long-term debt (the principal amount due within the next 12 months)
Non-Current Liabilities (due beyond one year):
- Long-term loans (equipment loans, mortgages)
- Less: Current portion already listed above
Equity: What’s Left Over
Equity represents the owners’ stake in the business.
- Paid-in capital (money owners invested)
- Retained earnings (cumulative profits kept in the business)
- Less: Owner distributions (money taken out)
Equity grows when the business is profitable and retains earnings. It shrinks when the business loses money or owners take distributions exceeding profits.
Note: For simplicity, Craig’s balance sheet shows equity as “Retained Earnings.” In practice, equity often includes separate line items for owner’s investment, retained earnings from prior years, and current year profit. The fundamental principle remains the same: equity represents what the owners have built in the business.
The Balance Sheet Equation
The equation always balances:
Assets = Liabilities + Equity
If you have $127,000 in assets and $96,400 in liabilities, your equity must be $30,600.
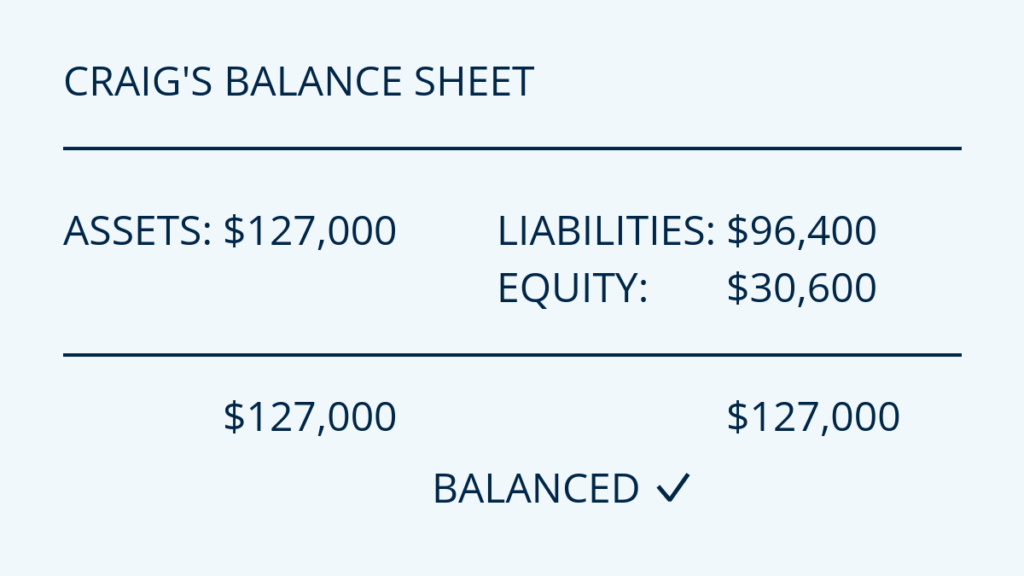
Craig’s Balance Sheet:
- Assets: $127,000 (what he owns)
- Liabilities: $96,400 (what he owes)
- Equity: $30,600 (what’s left over)
The equation balances: $127,000 = $96,400 + $30,600
Craig’s Balance Sheet (Simplified View):
Why the Balance Sheet Matters
It Shows What Your P&L Doesn’t
Your P&L shows economic activity: revenue earned, expenses incurred, profit or loss for a period.
Your balance sheet shows financial position: what you own, what you owe, what you’ve built.
Craig’s P&L showed consistent profitability: $11,100 per quarter.
His balance sheet showed a business operating with thin working capital, high leverage, and limited financial cushion.
Both statements were accurate. They measured different things.
The Core Difference:
Your P&L tells you if your business model works. Your balance sheet tells you if you can survive and grow.
It Answers Critical Questions
Can you survive a slow season?
Your P&L shows if you’re profitable on average. Your balance sheet shows if you have enough working capital to survive three bad months in a row.
Can you afford to grow?
Growth consumes cash. Inventory, equipment, accounts receivable, hiring ahead of revenue—all tie up cash before growth generates profit. Your balance sheet shows whether you have the working capital and debt capacity to fund growth.
Can you get financing?
Lenders evaluate balance sheet metrics: current ratio, debt-to-equity ratio, working capital, asset base, equity position. A profitable P&L helps, but lenders primarily underwrite your balance sheet.
Are you building wealth?
Your P&L shows if you made money this period. Your balance sheet shows if you’re accumulating wealth over time. Equity growth is the measure of real wealth creation.
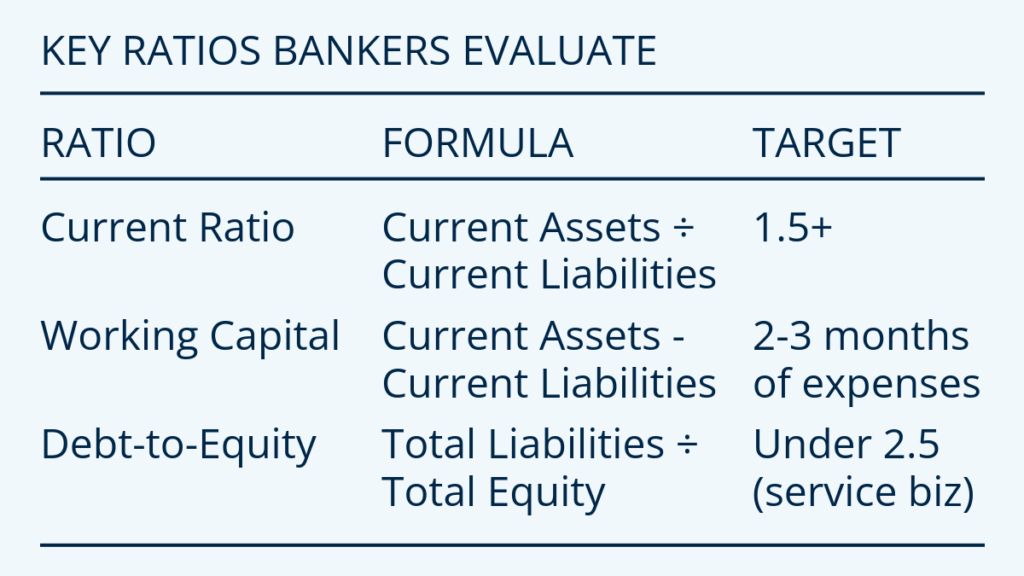
What Bankers Look At
When Jennifer reviewed Craig’s loan application, she looked at three specific metrics:
Current Ratio = Current Assets ÷ Current Liabilities
Target: 1.5 or higher
This measures your ability to pay short-term obligations. A ratio below 1.0 means you can’t pay current bills with current assets.
Working Capital = Current Assets – Current Liabilities
Target: Enough to cover 2-3 months of operating expenses
This is your financial cushion. The buffer between what you have coming in and what you owe going out.
Debt-to-Equity Ratio = Total Liabilities ÷ Total Equity
Target: Under 2.5 for service businesses
This measures leverage. How much you’re borrowing relative to what you own. High leverage means high risk—if revenue drops, you still owe the debt.
Targets vary by industry and deal structure, and lenders consider the full picture (trends, cash reserves, collateral, and guarantees). These are common minimums for expansion loans.
Key Financial Ratios Summary:
Common Balance Sheet Misconceptions
“I’m profitable but my equity isn’t growing”
You’re taking distributions faster than you’re earning profit. If you earn $50,000 in profit but take $60,000 in distributions, your equity decreases by $10,000 despite profitability.
“I have $50,000 in the bank but negative equity”
You owe more than you own. You’re operating on borrowed money. The cash is real, but it belongs to your creditors, not you.
“My balance sheet shows $200,000 in assets but I can’t spend any of it”
Assets aren’t the same as cash. Your assets might include equipment, accounts receivable, and inventory—only cash is spendable.
What Craig Did
Craig didn’t open the Anaheim location immediately.
Instead, he spent twelve months strengthening his balance sheet.
1. Paid Down Credit Card Debt
Craig stopped taking distributions and applied excess profit directly to his $28,000 in credit card balances. Over twelve months, he paid down $18,000.
Impact: Current liabilities decreased, debt-to-equity ratio improved significantly.
2. Improved Collections
Craig hired a part-time administrative person to manage collections more aggressively. He also negotiated with his hotel client to move from Net 45 to Net 30 terms.
Impact: Accounts receivable decreased from $16,400 to $12,800, freeing up $3,600 in cash.
3. Paid Down Equipment Loan
Craig made larger-than-required principal payments on his equipment loan whenever cash flow allowed, reducing the balance from $46,400 to $43,700.
Impact: Total liabilities decreased, improving both working capital and debt-to-equity ratio.
4. Built Cash Reserves
Craig retained more earnings instead of taking full distributions. He also reduced inventory by moving from bulk purchasing to just-in-time ordering.
Impact: Cash increased from $43,000 to $57,600. Most of the cash increase came from retained profits and tighter working capital—not from borrowing.
5. Continued Operating Profitably
Craig’s business generated $44,400 in profit over twelve months. He retained $25,000 of that and took $19,400 in distributions for personal expenses.
Impact: Equity grew from $30,600 to $55,600 ($30,600 + $25,000 in retained earnings).
The Improved Balance Sheet (12 Months Later)
Assets: $127,300
- Cash: $57,600
- Accounts Receivable: $12,800
- Inventory: $6,500
- Equipment (net): $50,400
Liabilities: $71,700
- Accounts Payable: $18,000
- Credit Cards: $10,000
- Equipment Loan: $43,700
Equity: $55,600
- Retained Earnings: $55,600
Craig’s equipment depreciated over twelve months (from $59,400 net to $50,400 net), reflecting depreciation and normal wear-and-tear for an equipment-heavy shop. He chose not to make major equipment purchases during this period, focusing instead on strengthening his financial position through debt reduction and cash reserves.
Key Metrics:
Current Ratio:
Current Assets ($76,900) ÷ Current Liabilities ($49,500) = 1.55
(Current liabilities: $18,000 accounts payable + $10,000 credit cards + $21,500 current portion of equipment loan = $49,500. Craig was nearing loan maturity, so more of the remaining principal fell due within 12 months.)
Note: Some lenders haircut inventory and older receivables when evaluating liquidity. Craig’s inventory is modest and his receivables are current, which helped.
Working Capital:
$76,900 – $49,500 = $27,400
Debt-to-Equity Ratio:
$71,700 ÷ $55,600 = 1.29
The Second Bank Meeting
Twelve months after his first attempt, Craig walked back into Jennifer’s office with his updated balance sheet.
Jennifer reviewed the numbers.
“This is excellent, Craig,” she said. “You’ve hit the three markers we discussed: current ratio above 1.5, working capital over $20,000, and debt-to-equity under 2.5. Liquidity is stronger, you’ve built cushion, and leverage is back in range.”
Craig had systematically addressed each concern Jennifer outlined twelve months earlier. His discipline and consistent execution demonstrated he could manage debt responsibly and maintain adequate reserves.
“Let’s get your application started,” Jennifer said.
Craig was approved for the SBA 7(a) loan three weeks later.
The Anaheim Location
Craig opened the Anaheim location four months after loan approval.
It took eight months to break even (longer than he’d hoped), but his improved balance sheet gave him the working capital to survive the ramp-up period.
By month twelve, Anaheim was generating $4,200 per month in profit. Combined with Santa Ana’s continued performance ($3,700 per month), Craig’s business was now generating approximately $95,000 annually in profit across two locations.
More importantly, Craig now monitored both his P&L and his balance sheet every month.
Why Blue-Collar Business Owners Need to Read Their Balance Sheet
Most business owners in retail, wholesale, manufacturing, home services, and construction look at their P&L constantly and their balance sheet rarely.
That’s backwards.
Here’s when the balance sheet actually matters:
You need financing:
Equipment loans, working capital lines of credit, SBA loans for expansion, or commercial real estate mortgages. Lenders underwrite your balance sheet first, P&L second.
You’re growing fast:
Opening additional locations, adding production capacity, hiring aggressively, or expanding service areas. Growth consumes cash through inventory, receivables, equipment, and hiring ahead of revenue.
You face seasonal fluctuations:
Landscaping (slow winters), retail (Q1 cash crunch after Q4 peak), pool service (off-season survival), construction (weather-dependent work). Your balance sheet shows if you have enough working capital to survive the slow season.
You’re considering major purchases:
New equipment, vehicles, facility expansion, or technology infrastructure. Your balance sheet shows whether you can afford it without destroying your working capital.
You’re evaluating business value:
Considering a partner, planning an exit, or getting approached by a buyer. Equity represents the value you’ve built.
What to Watch
Review your balance sheet monthly alongside your P&L. Look for these patterns:
Current ratio trending down – Your ability to pay short-term obligations is weakening.
Working capital declining – Your financial cushion is shrinking. This often precedes cash flow problems by 2-3 months.
Accounts receivable growing faster than revenue – Your customers are taking longer to pay. Your revenue is real, but your cash flow is getting squeezed.
Cash down + AR up – Your customers are financing their purchases with your cash.
Debt-to-equity ratio increasing – You’re borrowing more relative to what you own. Higher leverage means higher risk.
Equity flat or declining despite profitability – You’re taking distributions faster than you’re earning profit. You’re not building wealth.
Negative working capital – You can’t pay current obligations with current assets. This is a severe warning sign.
How to Use Your Balance Sheet
Monthly Review (10 minutes)
Pull your balance sheet on the last day of each month. Compare it to the prior month and the same month last year.
Ask yourself:
- Is my cash position improving or declining? If declining while profitable, where is the profit going?
- Is my working capital adequate? Rule of thumb: 2-3 months of operating expenses.
- Are my key ratios healthy? Current ratio above 1.2, appropriate debt-to-equity, positive working capital.
- Is my equity growing? If yes, you’re building wealth. If no despite profitability, you’re taking too much in distributions.
Quick Tips for Blue-Collar Business Owners
Before you expand or buy equipment:
- Calculate how the purchase affects your working capital
- Construction/landscaping: Keep enough cash to survive slow winter months
- Retail: Build reserves in Q4 to cover Q1 cash needs
- Home services (HVAC, plumbing): Maintain $15K-25K cushion for seasonal dips
Managing credit and debt:
- Pay down high-interest credit cards before taking on equipment loans
- Wholesale/distribution: Watch inventory—don’t tie up all your cash in stock
- Manufacturing: Factor in long collection cycles when calculating working capital needs
Working with seasonal revenue:
- Pool services, landscaping, construction: Your balance sheet needs to support 3-4 months of slow revenue
- Plan distributions during high season, not throughout the year
- Build cash reserves when busy, draw them down when slow
When Talking to Your Banker
Bring your balance sheet to every banking conversation. Understand your metrics before the banker asks:
- Current ratio
- Working capital position
- Debt-to-equity ratio
- Equity trend over the past 12-24 months
Bankers respect owners who understand their financial position. They’re skeptical of owners who only talk about revenue and profit.
Related Resources
Understand the foundation:
- The ABC’s of Financial Literacy: Part I – GAAP Basics
- The ABC’s of Financial Literacy: Part II – Understanding Margins
- The ABC’s of Financial Literacy: Part III – Cash vs. Revenue
Understand the cash flow implications:
- Understanding Revenue Recognition and Cash Flow
See the warning signs:
- 5 Financial Red Flags Every Small Business Owner Should Watch
Need guidance?
Talk to your CPA or a fractional CFO who can help you analyze your balance sheet, model major decisions, and prepare for financing conversations.
Take Action Now
Don’t wait until you’re sitting in a banker’s office to learn what your balance sheet says about your business.
If you’re a business owner: Pull your balance sheet today. It takes 10 minutes. Calculate your current ratio, working capital, and debt-to-equity ratio. If the numbers concern you, talk to your CPA about creating an improvement plan before you need financing.
If you’re an advisor: Share Craig’s story with your clients. Use it to start conversations about balance sheet health before they face a denied loan application. The best time to strengthen a balance sheet is before it matters—not after a banker says no.
Conclusion: Two Financial Statements, Two Different Questions
Craig spent two years watching his P&L every month. He never looked at his balance sheet once.
That almost cost him the biggest growth opportunity he’d ever had.
The P&L answers: “Is my business model working?”
- Am I making money on each sale?
- Are my margins adequate?
- Are my expenses controlled?
- Am I profitable?
The balance sheet answers: “Can I survive and grow?”
- Can I pay my bills for the next 90 days?
- Can I afford this equipment or expansion?
- Will the bank approve my loan?
- Am I building wealth or just trading time for money?
You need both.
The P&L tells you if you’re running a good business. The balance sheet tells you if you’re building a strong business.
Craig learned this lesson the hard way—but he learned it before it was too late.
Don’t wait for your banker to teach you what your balance sheet says about your business. Learn to read it yourself.
Owner Checklist
Monthly routine (do these every month):
□ Pull your balance sheet on the same day you review your P&L
□ Calculate your current ratio (target: 1.5+)
□ Calculate your working capital—make sure you have enough to cover slow seasons (winter for construction/landscaping, post-holiday for retail, off-season for pool services)
□ Calculate your debt-to-equity ratio (target: under 2.5 for service businesses, under 4.0 for asset-heavy businesses like manufacturing)
□ Track equity growth over time—this shows if you’re building wealth or just covering expenses
□ Share your balance sheet with your CPA monthly to prepare for bank meetings and flag concerns before they become problems
Before major decisions:
□ Model the balance sheet impact before buying equipment, opening locations, or taking on debt
□ Before talking to your banker, know your three key ratios (current ratio, working capital, debt-to-equity)
□ Stress test major decisions: Can you handle 3 months of slow revenue? What if sales drop 20%?
Industry-specific reminders:
□ Construction/HVAC/Plumbing: Keep enough working capital to survive winter or slow months (typically $20K-40K depending on crew size)
□ Retail: Build cash reserves in Q4 to survive Q1-Q2 cash crunch
□ Wholesale/Distribution: Watch inventory levels—don’t tie up all working capital in stock
□ Manufacturing: Account for long payment cycles (Net 60-90) when calculating working capital needs
□ Home Services: Before buying trucks or equipment, ensure you have $15K-25K liquid reserve
Before seeking financing:
□ If your ratios are weak, acknowledge it and present your improvement plan
□ Review both P&L and balance sheet—never just one
Advisors: Use this checklist to guide clients toward stronger balance sheets before financing or growth decisions.
Master both statements and you’ll make better decisions, get better financing terms, and build a business that doesn’t just generate profit—it builds lasting value.